|
Gas |
RANGE (ppm) |
Resolution |
|
Hydrogen(H2) |
5.0~5000.0 |
2ppm NA |
|
Carbon Monoxide(CO) |
1.0~50,000.0 |
2ppm |
|
Carbon Dioxide(CO2) |
2.0~50,000.0 |
0.1ppm |
|
Ethylene(C2H4) |
1.0~50,000.0 |
0.1ppm |
|
Ethane(C2H6) |
1.0~50,000.0 |
0.1ppm |
|
Methane(CH4) |
1.0~50,000.0 |
0.1ppm |
|
Acetylene(C2H2) |
0.5~50,000.0 |
0.1ppm |
|
Acetylene(C2H2)Optional |
0.1~50,000.0 |
0.1ppm |
|
Water(H2O) |
More than 5 PPM |
2ppm NA |
|
Accuracy or tolerance |
when valve <20ppm±1ppmwhile > 20ppm ,±10% | |
|
Oil sample |
50ml±2ml | |
|
gas sample |
5ml±0.2ml | |
|
PC port |
USB | |
|
Printing output |
2 inch mini printer | |
|
Power |
100~250VAC, 4~63Hz, 12W | |
|
Weight |
10Kg | |
|
Dimension |
524× 428 × 206 mm | |
● Fast measuring in the field
Within 20 minutes, 7 key fault gases and moisture can be read.
● No consumables
Pure physical photo-acoustic spectroscopy technology, The consumables of calibration gas and carrier gas are needless.
● Moisture in the oil
The concentration of moisture in the oil can be given during the same one test,±1ppm.
● Simple
Step-by-step software guides and touch screen, the user pass through the procedure.
● Portable and rugged
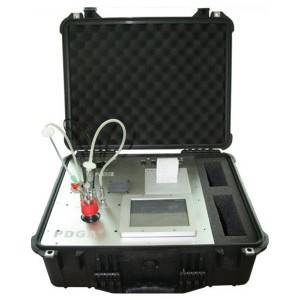
Weighs <10 Kg, in a rugged and convenient carry case.
● Reliable
Engineered design provides inherent reliability and high accuracy.
● DGA diagnosis
International general faults gases diagnosis method, preset the warning limits.
Roger’s ratios, Duval’s Triangle, IEEE key gases.
● PC communication
External PCs is possible via USB connections, allowing databases to be imported or downloaded.
● Samples
Oil and gas.
Test equipment for analysis the disolved gas in transformer oil.
Theory:
The photo-acoustic effect is caused by the ability of a gas to absorb electromagnetic radiation (e.g. infrared light). In absorbing the radiation the temperature of the gas will increase and, if the gas is held in a sealed container, this temperature rise will produce a proportional rise in pressure. If the light source is pulsed the pressure of the gas fluctuates in sympathy and these pressure waves can then be detected using sensitive microphones.
There are two key facts that permit this effect be used for analytical measurements. The first is that each gas has a unique absorption spectrum, thereby allowing the frequency of the infrared source to be tuned to excite a given substance. The second is that the level of absorption is directly proportional to the concentration of the given gas.
Therefore by selecting an appropriate wavelength and measuring the level of the resultant signal it is possible to detect, not only the presence but also the concentration of any given gas, even in a complex cocktail of other compounds. This forms the central principle of Photo-Acoustic Spectroscopy (PAS).
After the gas is extracted from the oil by controlled excitation
of the sample it is then analyzed using photo-acoustic spectroscopy, the same method used by the European Space Agency for monitoring blood gases .
The Diagram illustrates the principle. Pulses of Infrared light are generated using a radiation source and a chopper wheel (Fig 1). These pass through a series of optical filters in turn, Labeled as the wavelength section (Fig 2) .
Each filter is optimized to pass the resonant frequency for a particular gas (e.g. Methane, CH4).The pulses of filtered IR radiation then pass through the cell containing the sample to be analyzed, as shown in the diagram.
Each particular gas (e.g. CH4) absorbs energy at its resonant frequency, causing a vibration in the molecules. This absorbed energy is quickly released creating small pressure waves.
Two microphones pick up these pressure waves, at the Frequency of the pulses of IR light, with the amplitude of the signal measured corresponding to the amount of the specific gas present.


